%201.avif)

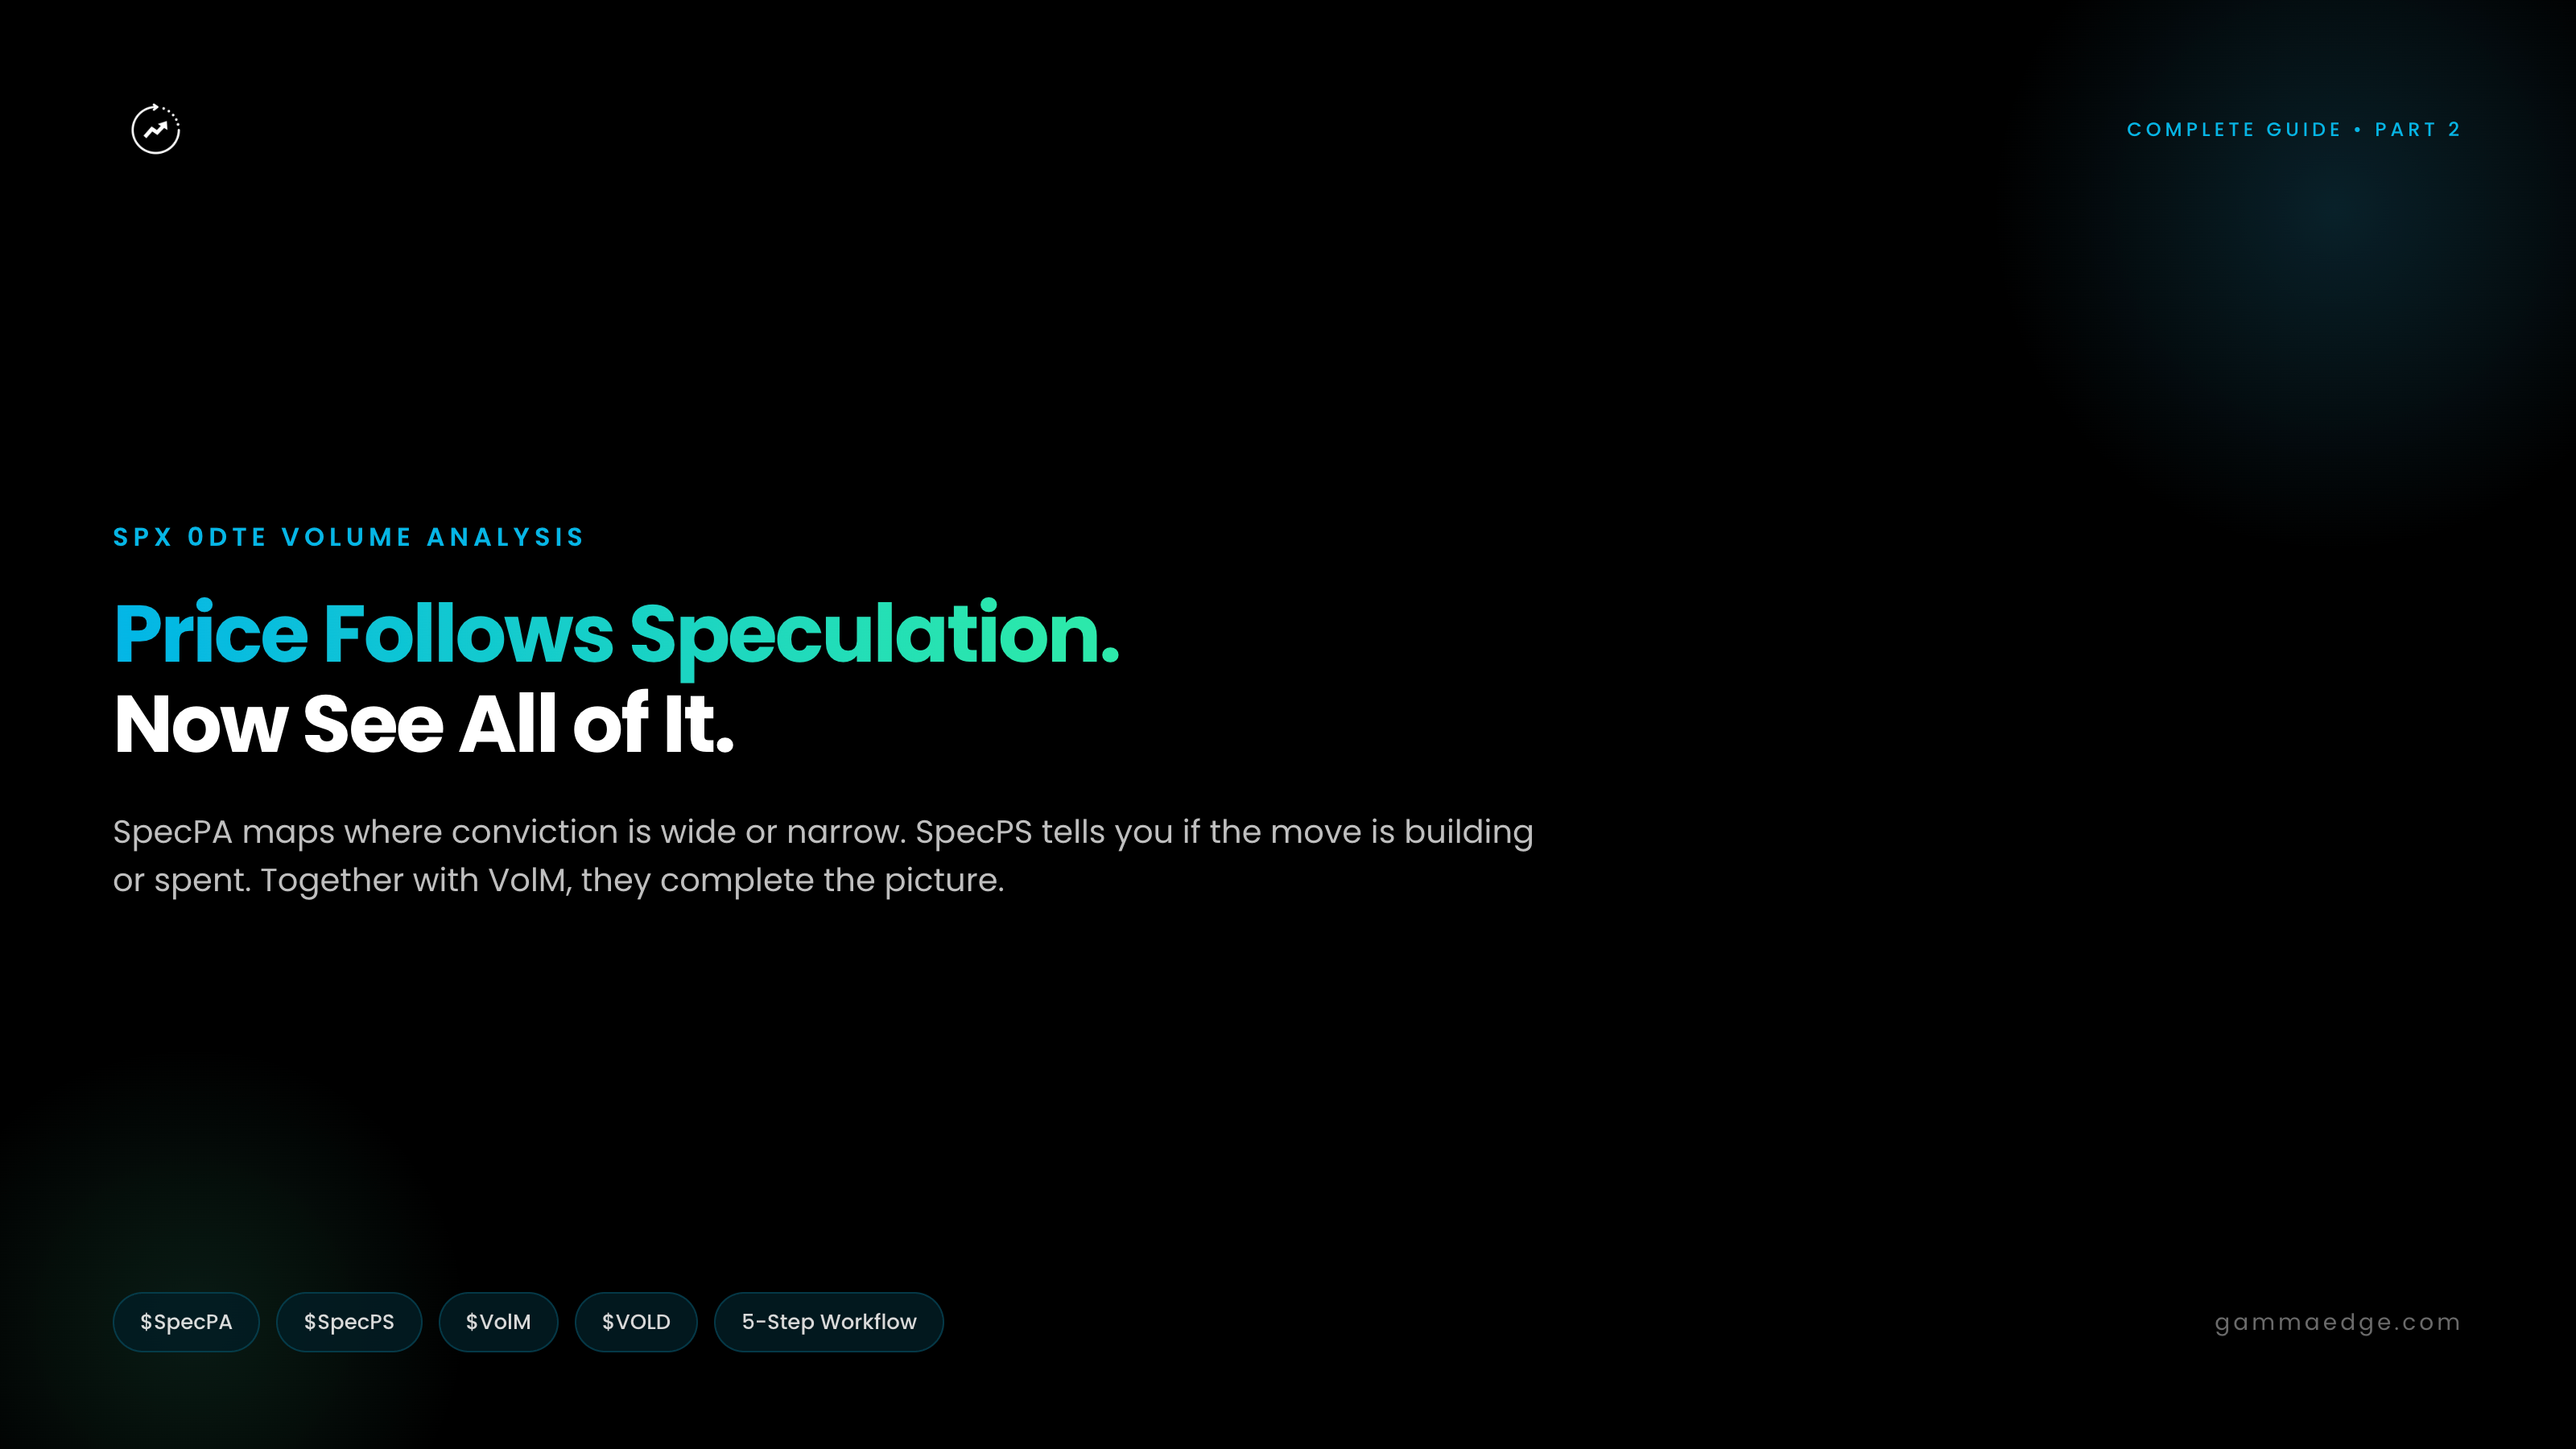
Price Follows Speculation Part 2: SpecPA, SpecPS, and Your Complete Intraday Volume Workflow
.png)
Taylor Drake
.png)
May 1, 2026
.png)
15mins read
VolM (Volume Momentum) answers the most important question of the trading day: where is speculation clustering, and which direction is it trending? If you've read the companion article, you know the five patterns, you understand the concentration lines, and you can read the lines of best fit as a directional guardrail.
But sometimes you need more.
Specifically, you need to know:
Those questions led us to build two additional tools that fork from VolM, each answering a different dimension of speculative activity that VolM alone doesn't show you.
Note to the reader: This is the companion to "Price Follows Speculation: A Complete Guide to SPX 0DTE Intraday Volume Analysis (Part 1." If you haven't read it yet, start there. It covers the foundation of how volume by strike evolves through the session and introduces VolM, the core tool you'll use every day. Everything in this article builds on that foundation.
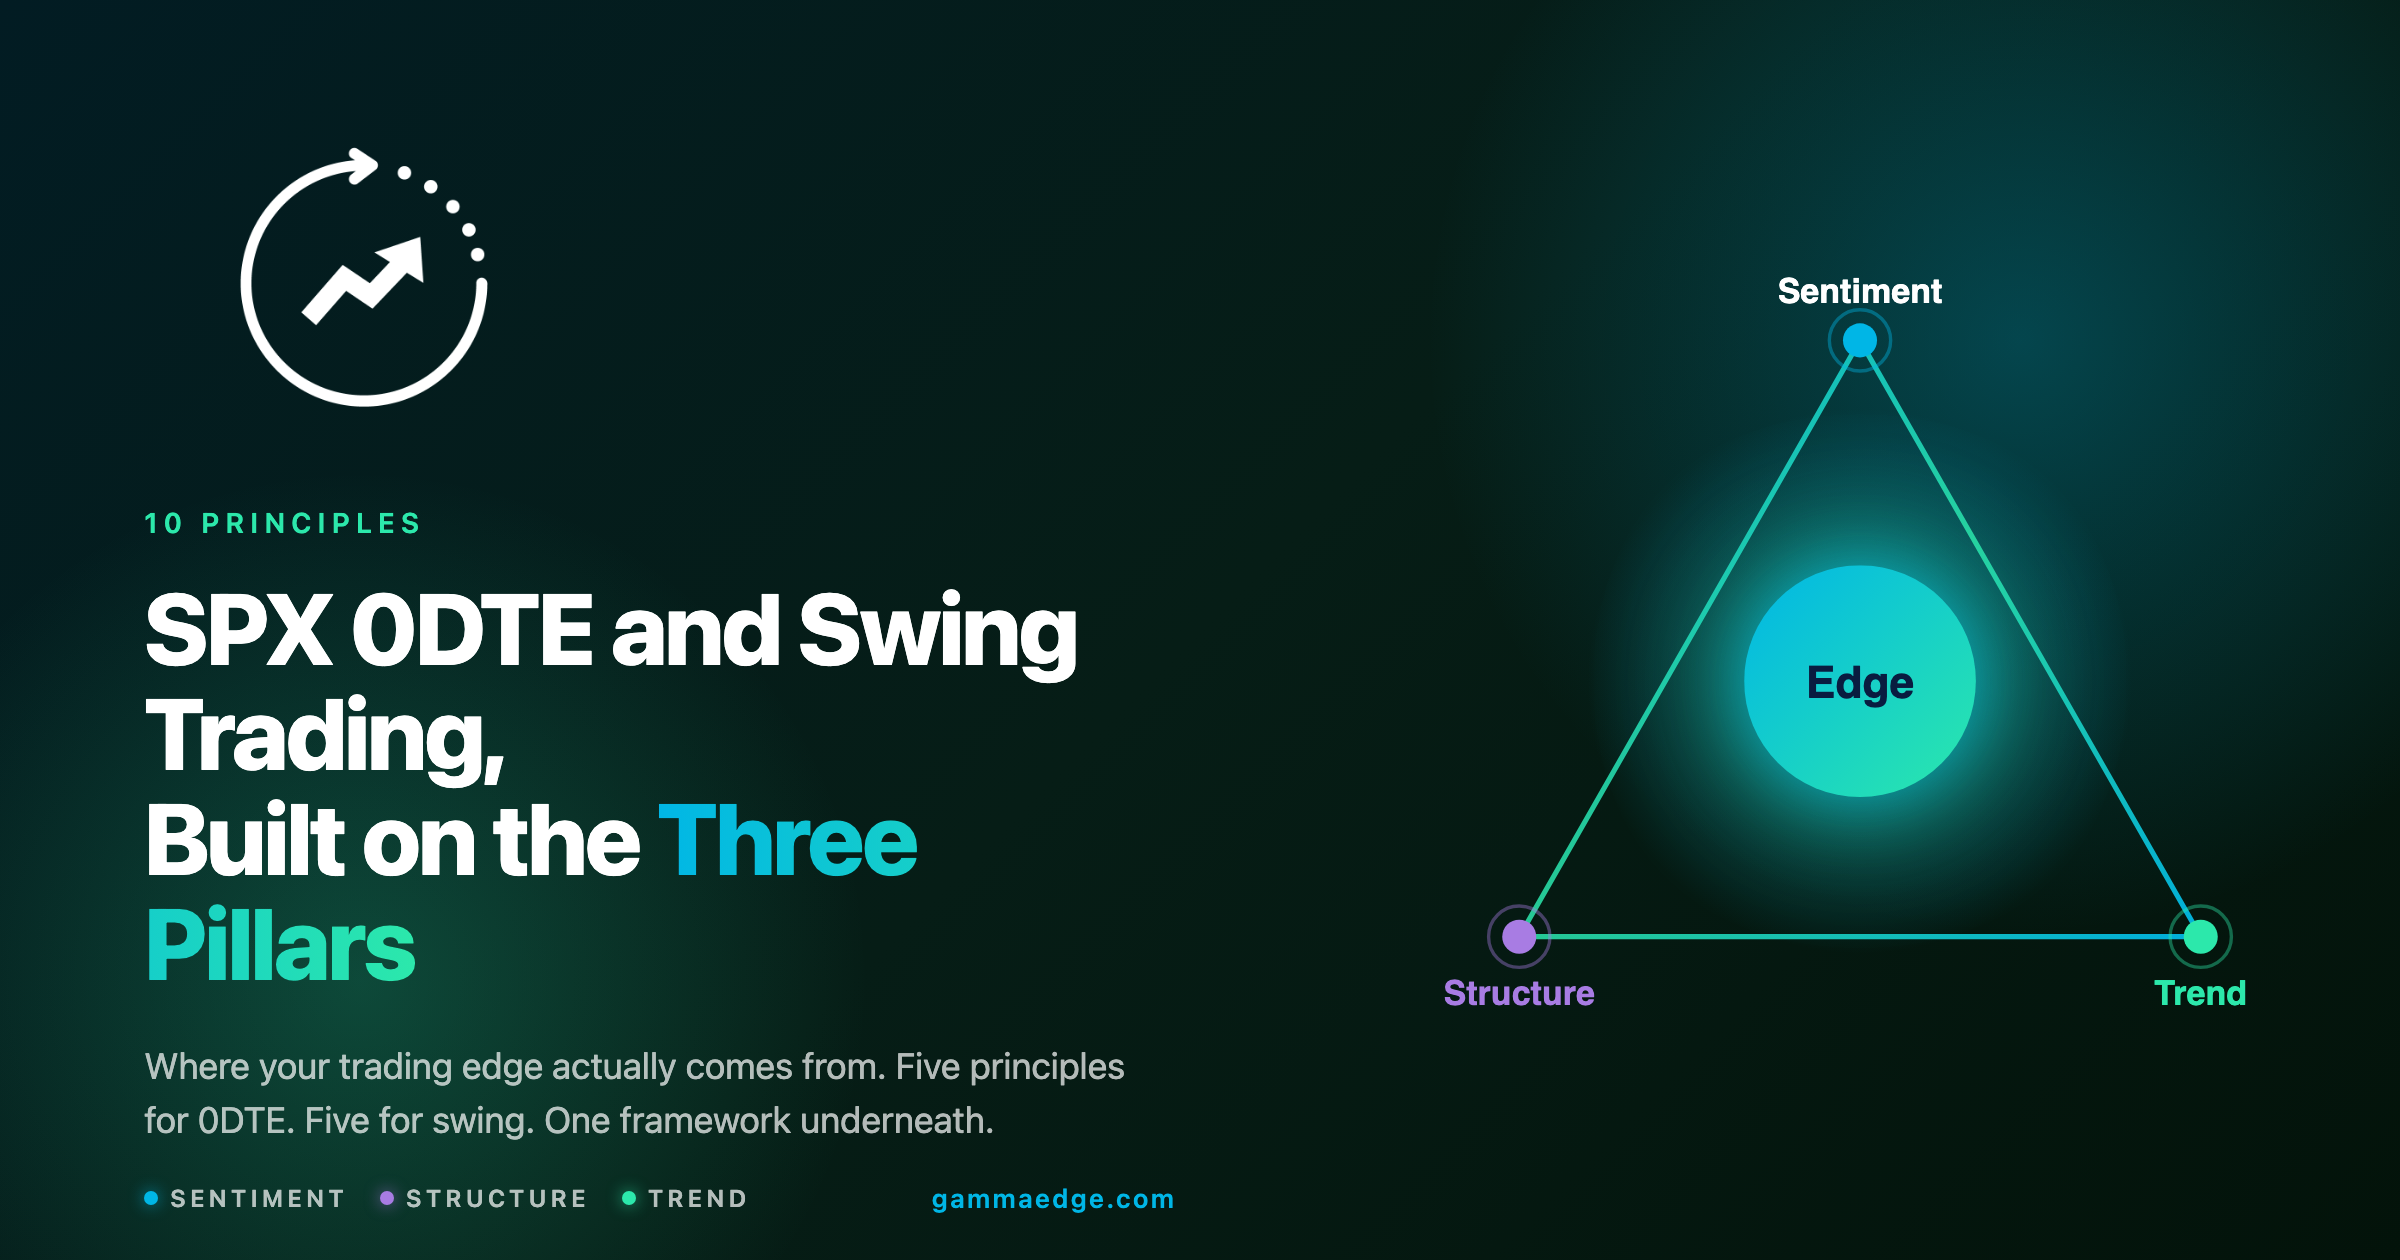
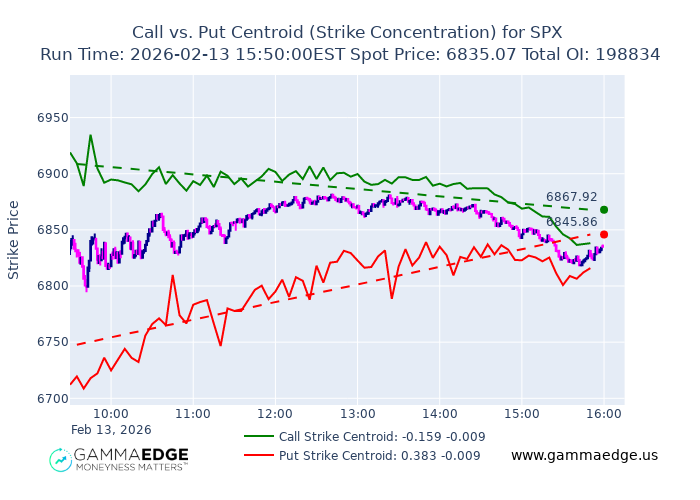
If VolM shows you where the center of speculation is, SpecPA shows you the full shape. Every cohort of speculators, from the most conservative to the most aggressive, all plotted on one chart.
Those boundaries often define the likely range of price action for the entire session, and SpecPA makes them visible.
You know it's a trending day. VolM told you that. But how far can this move actually go? Where's the ceiling? And is the conviction behind it clustered tight, or is speculation scattered all over the place? That's the difference between pressing your trade with confidence and getting cautious because nobody agrees on where this thing is headed.
SpecPA answers these questions by breaking the data into cohorts of speculators, grouped by how aggressively they're positioned.
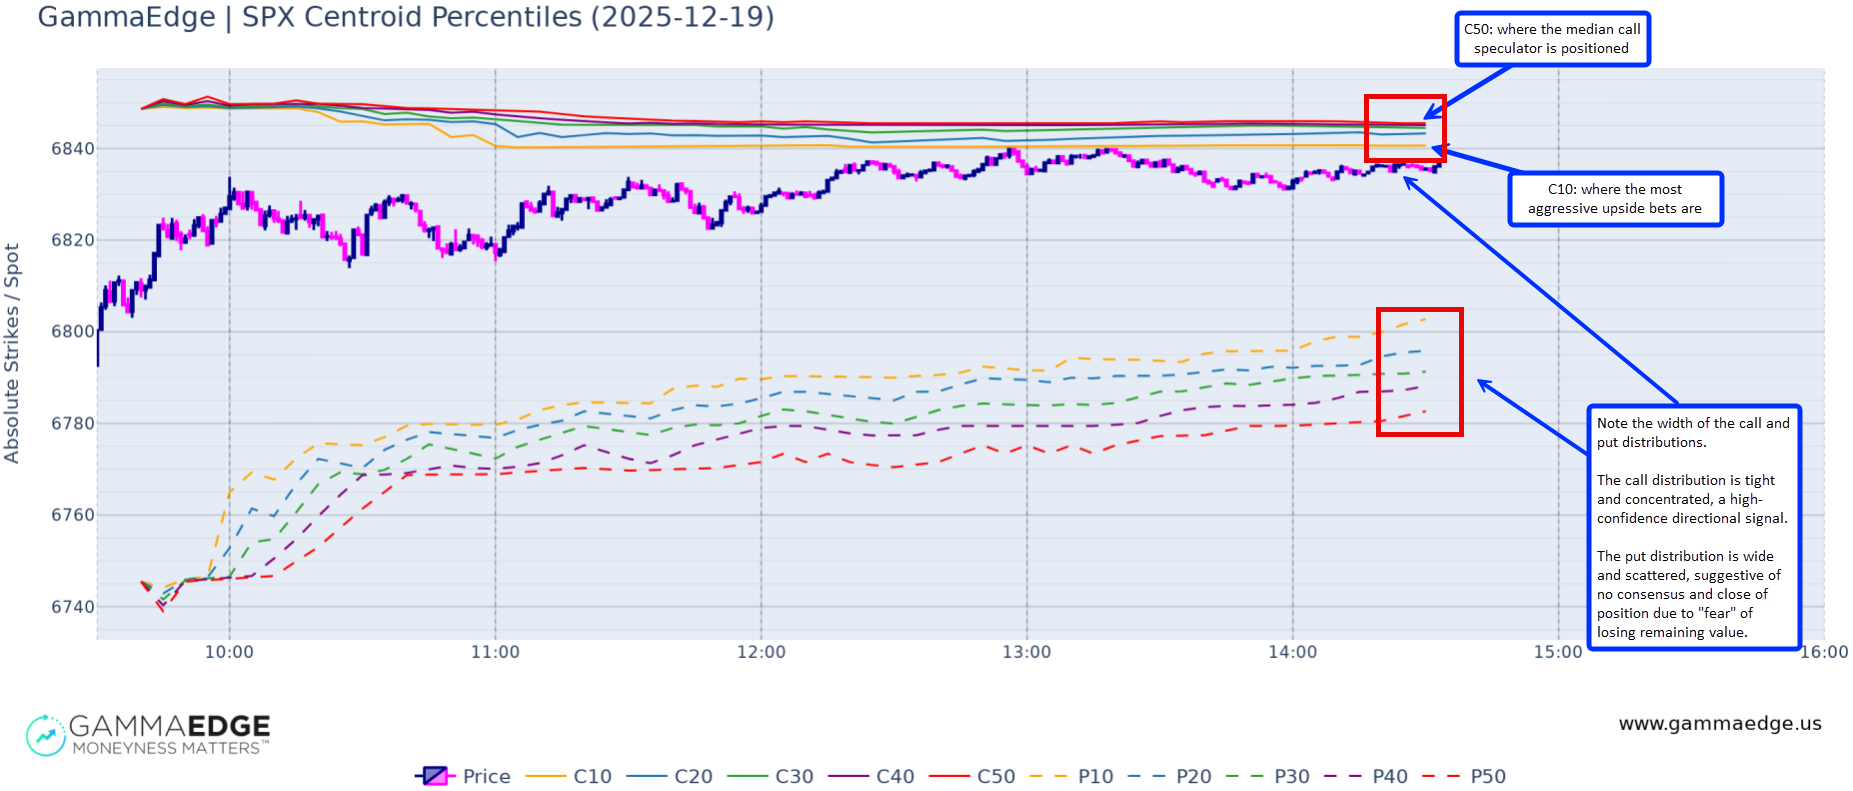
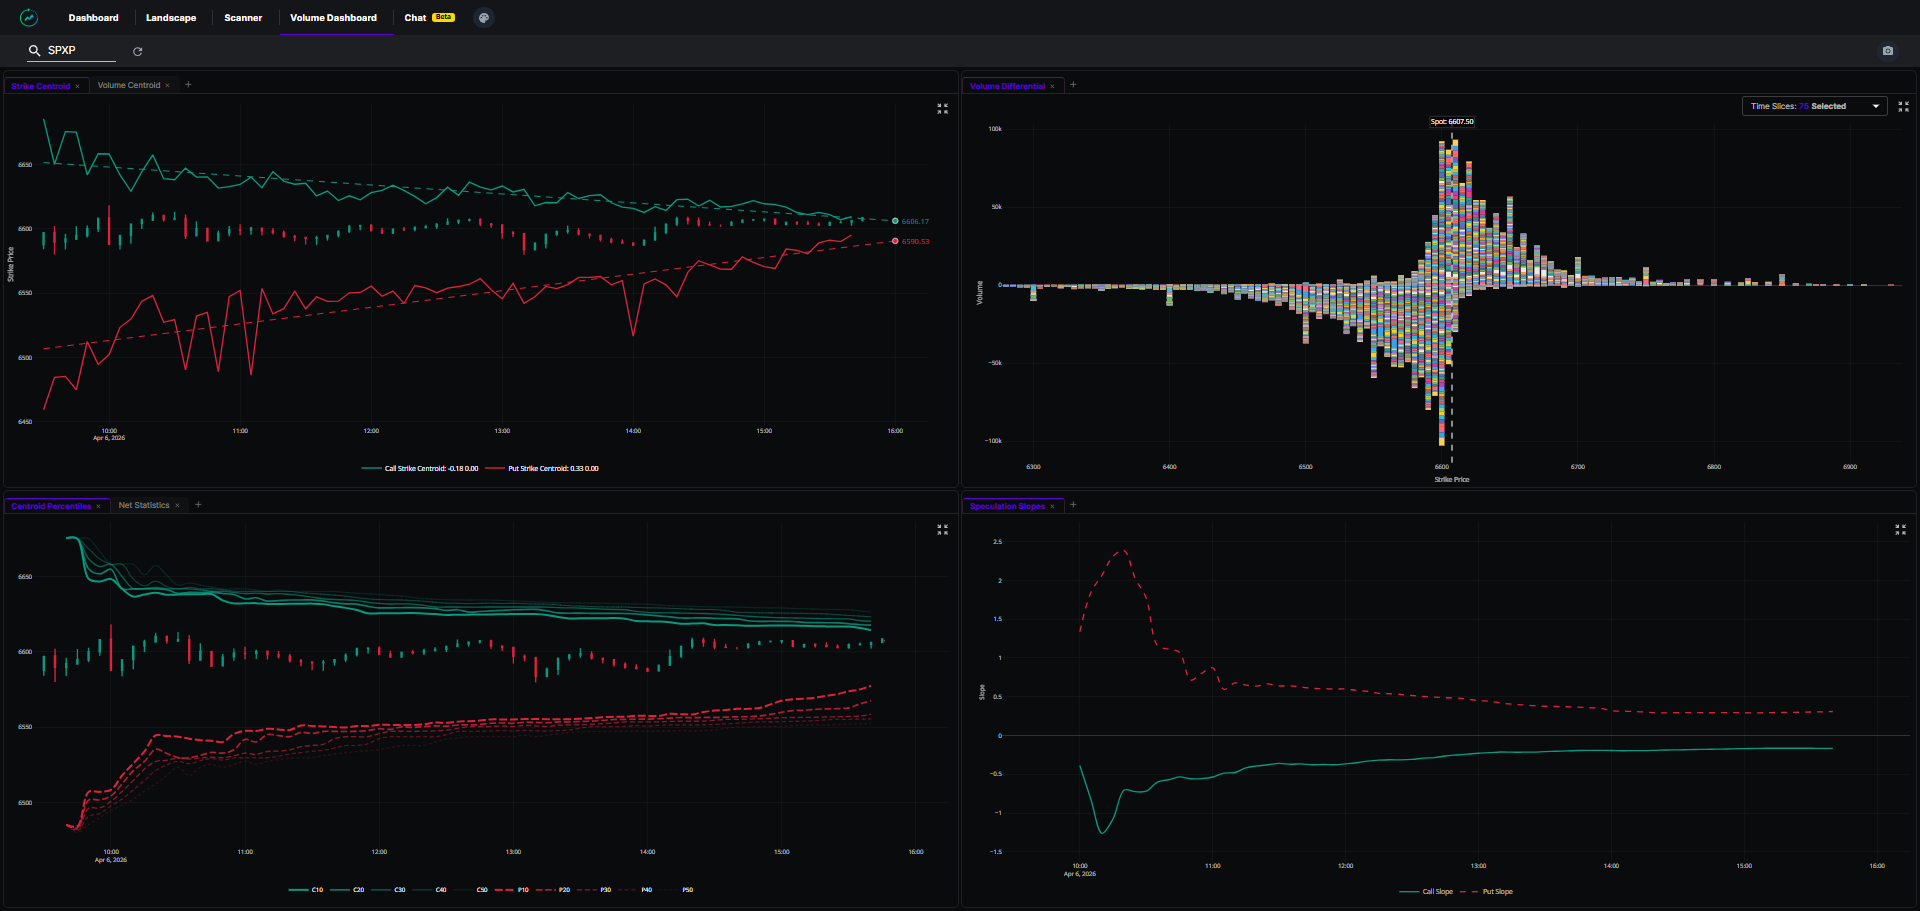
On the call side, you'll see lines labeled C50, C40, C30, C20, and C10. The C50 line represents the median: 50% of all call speculation for that period is at that strike level or lower. The C10 line represents the 10th percentile, only 10% of call speculation is reaching that far. In other words, C10 (and below) is where the earliest upside speculators are targeting.
The put side works the same way: P50, P40, P30, P20, P10. P10 represents the nearest, earliest downside bets.
The nickname "spaghetti models" comes from the visual: all these lines plotted together look like the spaghetti models used to track the path of a hurricane. But each strand tells you something specific about a different cohort of speculators and how far they're reaching.
You don't need to overanalyze every line. Three reads give you everything you need from SpecPA.
1. Bandwidth tells you the conviction level.
When the bands are tight (C10 sitting close to C50), speculators are clustered. They agree on where the action is, and their conviction is concentrated in a narrow range of strikes. That's a high-confidence directional signal. When you see tight bands trending in one direction, even horizontally, that's confirmation to press your directional trades with more confidence.
When the bands are wide (P10 far from P50), speculation is scattered. Different cohorts are targeting very different strikes, and there's no consensus. That's uncertainty, and it usually corresponds with choppy, indecisive price action. This also suggests closing contracts in a random manner, rather than focused targeting to establish new contracts.
2. Price within the bands is a normal day.
In a typical session, price bounces around within the spaghetti model boundaries. Think of the bands as informal guardrails for the day's range. When price touches the outer boundary (say, the C10 line on the call side) and bounces back, that's normal mean-reversion. The speculation boundary is where prior speculators have hit 50-delta, which is peak-gamma convexity, and are likely to monetize.
The outer lines (C10 on the call side, P10 on the put side) often correspond closely with the session's highs and lows. That alone makes them worth watching.
Use the outer boundaries as informal targets: if you're long and spot price is approaching the C10 line, that's a natural area to consider taking some profit.
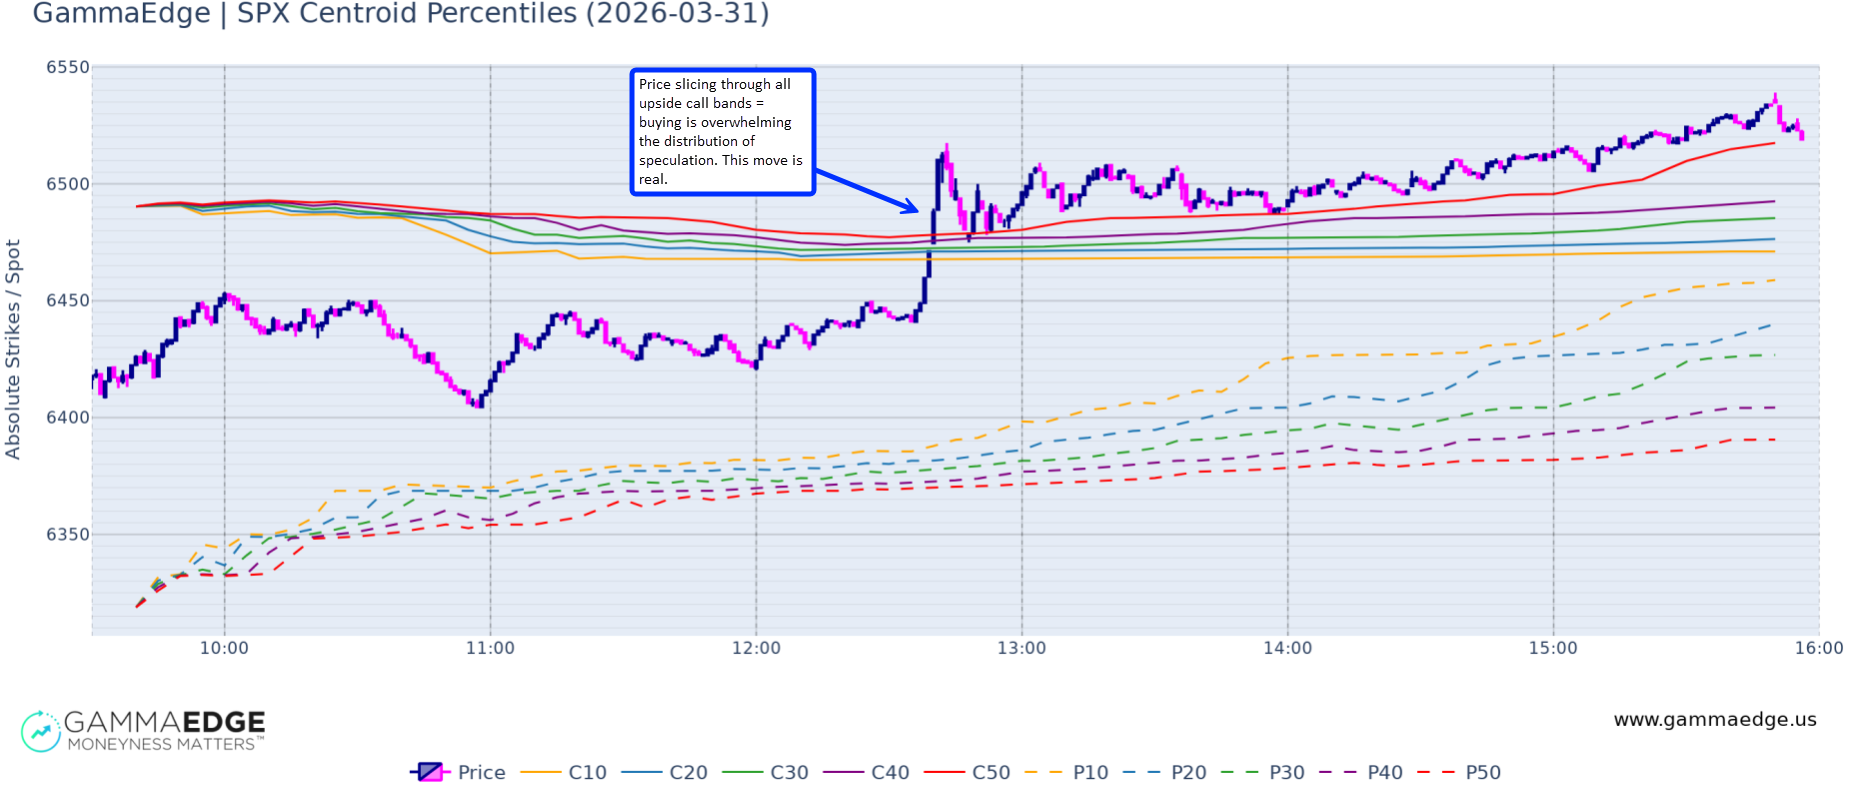
3. Price slicing through the bands is a definitive signal.
This is the one that really matters. When price doesn't just touch the spaghetti model boundary but breaks aggressively through it, the selling (or buying) is overwhelming the entire distribution of speculation for that time interval. That's not a normal pullback. It's a genuine directional move that's overpowering what speculators had positioned for.
On aggressive buying days, you'll see price slice right through the upper call distribution bands with heavy, sustained buying pressure. When price breaks through the bands, it's telling you the move is bigger than what speculators anticipated: either get on board or get out of the way.

One more thing to watch for: bands tightening while price stays flat. This is subtle but powerful.
When the spaghetti lines are converging toward each other, with different cohorts of speculators clustering around an increasingly narrow range of strikes, it often signals building conviction before a move occurs. Price looks like it's doing nothing, but the speculative positioning is compressing like a spring. The tightening itself is the tell. When you see the bands narrow meaningfully while price stays range-bound, pay attention. The next directional move often follows shortly after, because all that concentrated conviction eventually expresses itself in price.
SpecPA tells you where every cohort of speculators is positioned and how wide or narrow their conviction is. That's the spatial read, the full map of speculative distribution. But there's another question it doesn't answer: how fast is that distribution shifting, and is it accelerating or fading?
That's SpecPS.
You're sitting at a key level. Price has been grinding higher for the past two hours. The VolM concentration looks constructive, the spaghetti models confirm speculation is concentrated to the upside. Everything looks good on paper.
But the question nagging you is the one that matters most: is this move still building, or has the speculative energy already been spent?
That's the problem SpecPS solves.
Think of SpecPS as a speedometer for speculative conviction. VolM tells you where speculation is. SpecPA tells you how wide or narrow it is. SpecPS tells you how fast it's moving, and whether that pace is picking up or slowing down.
It does this by tracking the slope of the lines of best fit in real time.
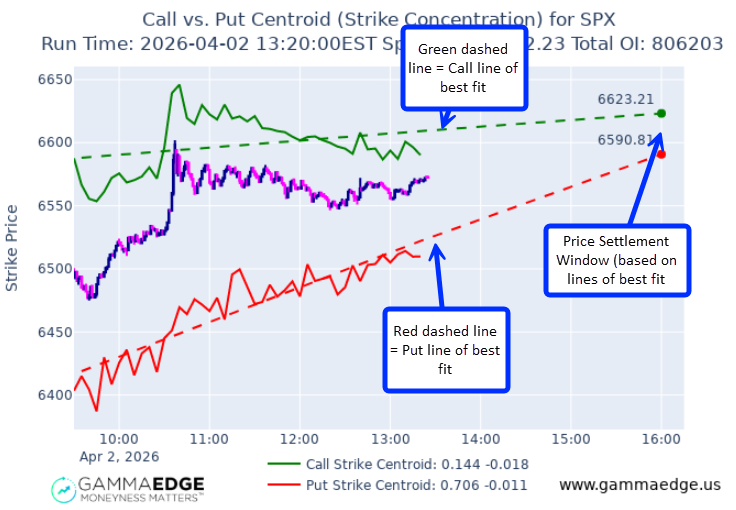
Quick refresher from Part 1: the lines of best fit are the dashed lines on the VolM chart that project where the concentrations of speculation are headed by the close. They take the trend of speculation from the open to wherever we are in the session and extend it forward. SpecPS tracks the slope of those lines, which indicates whether the forward projection is steepening, flattening, or reversing.
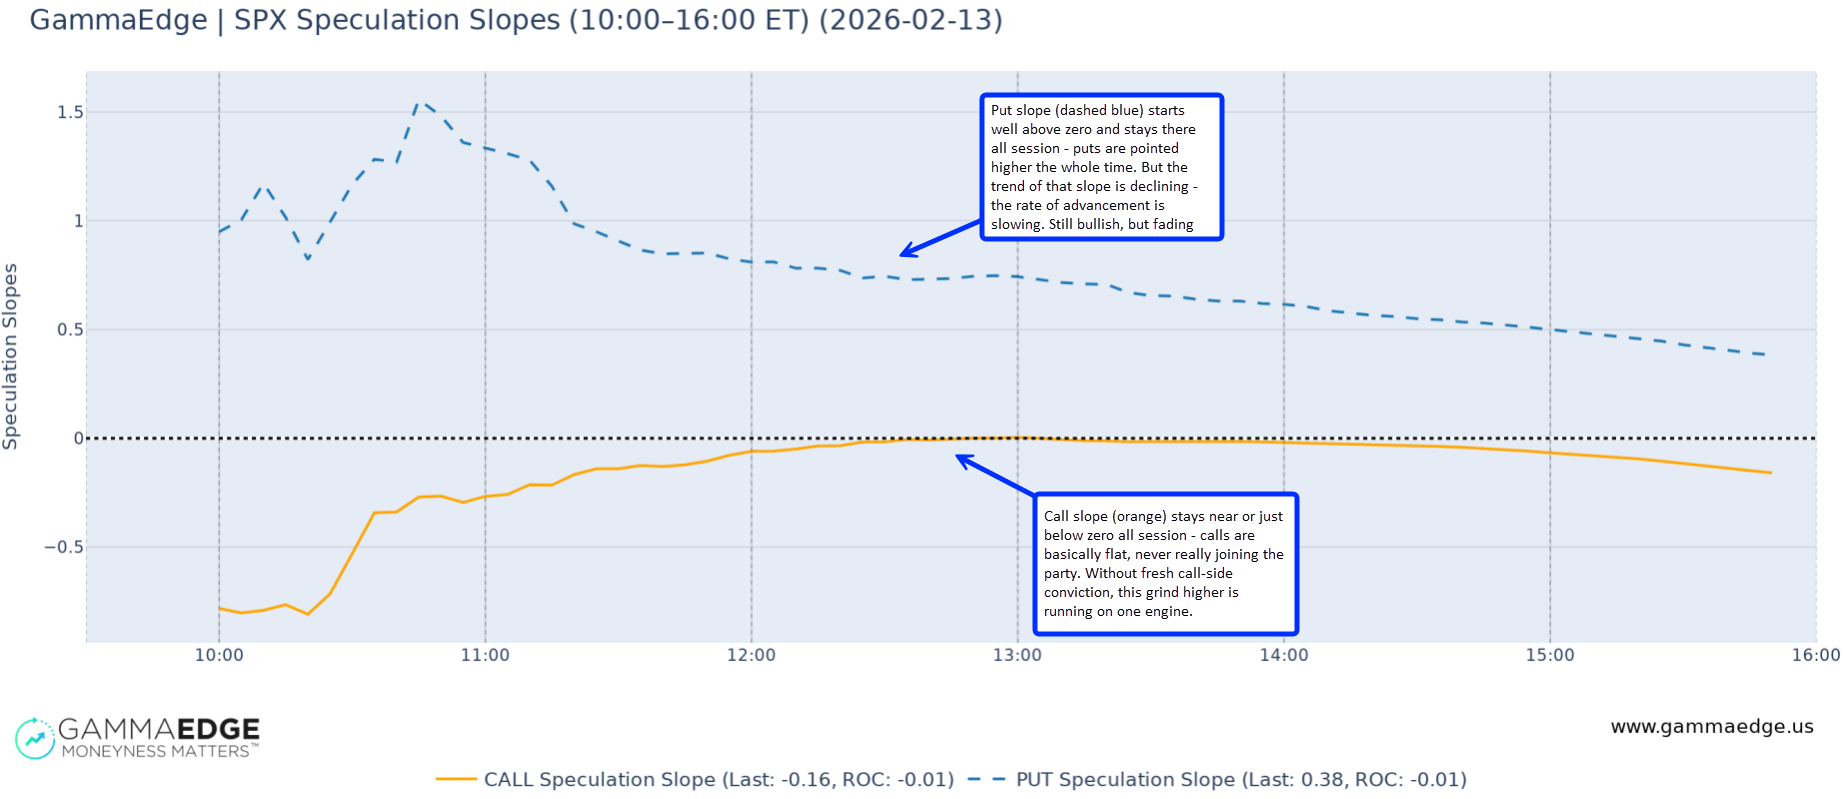
The zero line is your anchor. When the slope is above zero, the lines of best fit are pointing higher, meaning speculation is trending to the upside. When it's below zero, the lines of best fit point lower, meaning speculation is trending lower.
But direction alone isn't the full picture. What matters just as much is what the slope itself is doing: is it rising, falling, or flat?
Consider a scenario where the slope is below zero, meaning speculation is still pointed lower. But if that slope is trending higher, it means the downside momentum is fading. The lines of best fit are still negative, but less so than before. The bearish energy is losing steam, even though it hasn't flipped bullish yet. That's a very different environment than a slope below zero and falling further, which tells you the selling is actually accelerating.
The same logic works in reverse. A slope above zero that's trending lower means the bullish momentum is cooling. Speculation is still pointed higher, but with less conviction than before. The upside isn't done yet, but the energy behind it is weakening.
So you're really watching two things at once: where the slope sits relative to zero (direction) and which way it's trending (momentum in that direction). Together, those two reads tell you whether the current move is building, sustaining, or fading, and that's exactly what you need to know when you're deciding whether to enter, hold, or step aside.
There's one more read from SpecPS that's worth its weight in gold, and it's about knowing when not to chase.
When price has been grinding higher for hours and the slope has been positive the entire session, you might look at the chart and think "this is strong, I should get in." But what SpecPS is actually telling you is that the speculative work is largely complete. By the time price has melted up into the upper distribution lines, speculators at those levels are sitting at 50 to 70 deltas with no particular reason to sell unless a news event pulls them down. Theta is just burning away. The move isn't over, but the energy that drove it is spent. What's left is drift, not acceleration.
This is incredibly valuable information. It tells you it's too late to chase, but also that a sudden reversal is unlikely without a catalyst. The session is coasting on fumes, not building new momentum. Knowing the difference between "this trend still has fuel" and "the speculative work is done" keeps you from making late entries that have no upside left in them.
This single read, knowing when the speculative work is done, could save you from the most expensive mistake in 0DTE trading: chasing a move that has nothing left to give.
Here's the good news: you don't need to run all of these tools simultaneously. VolM is sufficient for most trading sessions. It tells the day's character, shows you the trend of speculation, and projects where the session is likely headed. That's your daily driver, and for many sessions, it's all you need.
SpecPA and SpecPS add depth when you want it. They "fork" from VolM to answer more specific questions (how wide is conviction, and is the momentum building or fading) and they're there when you need that extra layer of granularity. But they're supplements, not requirements.
Here's how the workflow plays out in practice.
This is always your starting point. Pull up VolM and watch the concentration lines develop. By mid-morning, generally around 10:30 am ET, you'll start to see one of the five patterns forming: both concentrations higher (trending up), both lower (trending selloff), converging (chop), or one side flat while the other trends (the sideways drift or sideways grind).
After the London close at 11:30 AM ET, the pattern is typically well established, and you can trade with confidence based on that reading. Before 10:30, the patterns are still forming and usable for awareness, and as you roll into the 11:00 AM ET and 11:30 AM period, you can likely form a foundation for your biggest decisions.
This single step answers the most important question of the day: trending or choppy? And if trending, which direction?
Once the day's pattern is established, the lines of best fit give you a forward-looking projection. Based on everything that's transacted so far, where are the concentrations of speculation headed by the close? All else being equal, if we understand where speculation is trending, we have a strong sense of where price may finish the session.
Use this as a directional guardrail. If the lines of best fit are projecting higher, don't sell against that. If they're projecting lower, don't try to catch the bottom. The lines update every 5 minutes as new values come in, so the projection stays current with what's actually happening.
If you want to see how wide or narrow conviction is, or where the outer boundaries of speculation sit, pull up SpecPA. The spaghetti models tell you whether speculators are tightly clustered (high conviction, directional confidence) or scattered across a wide range (uncertainty, likely chop).
Pay attention to where price sits relative to the bands. Price within the bands is normal. Price slicing through them is a definitive directional signal that the move is overwhelming the distribution of speculation.
Here's where it gets powerful: if VolM shows a trending day (Pattern 1, trend day higher) AND SpecPA shows tight bands trending in the same direction, that's maximum conviction. The center of speculation and the full distribution are both confirming. Press your trades with confidence. But if VolM shows a trending day and SpecPA shows wide, scattered bands, the center says trend but the distribution says uncertainty. That's a session to participate in, but with less size and tighter management.
If you're sitting at a key level and need a fast answer on whether the move has legs or is fading, glance at SpecPS. Slope above zero and sustained? The trend has conviction. Slope fading toward zero? The energy is dissipating. Slope briefly crossing zero and falling back? The breakout isn't real.
And if the slope has been positive for hours and price has been grinding higher the entire session, that's the "move is already done" signature. The speculative work is complete. It's too late to chase, but a sudden reversal is also unlikely without a catalyst.
The most valuable combination: VolM shows Pattern 1 (trend day higher), SpecPA confirms tight bands, and SpecPS shows slope above zero and rising. Every tool agrees: direction, conviction, and momentum are all aligned. That's your highest-confidence environment. Conversely, if VolM shows a trend but SpecPS slope is above zero and falling, the trend is intact but losing energy. That's not a signal to reverse. It's a signal to manage what you have rather than add.
If a concentration makes a sudden, unusual move on the VolM chart and you want to know why, VOLD is your investigative tool. Drop into the specific time slice and see what happened: sometimes a single outlier strike with heavy volume can skew a concentration for that period. VOLD shows you whether the move was driven by broad conviction or a single anomaly.
The structural levels you set up premarket (transition zones, key strikes, the levels on your dashboard) are your roadmap for the session. But intraday volume tells you whether that roadmap is still accurate or being rewritten in real time.
When VolM is trending strongly in one direction and price is approaching a structural level, the volume tools are the tiebreaker. They tell you whether that level will hold or break. Sufficient volume-driven targeting can push right through levels that the premarket structure said should hold. The structure sets the goalposts. The volume tools tell you whether the ball is actually headed there, and with how much force.
Respect what's happening, not what you expected to happen.
Quick tip: If you're working in Discord, the `$spec` command pulls all of this into a single chart. Same information, one command. Think of it as the unified view of everything we've covered in this article.

No. Start with VolM. Get comfortable identifying the five patterns. Learn to read the concentration direction and the lines of best fit. That alone gives you an enormous edge for your intraday trading. SpecPA and SpecPS add granularity when you want to see the full distribution of speculation or gauge whether momentum is building or fading, but they're supplements, not prerequisites. Many traders use VolM exclusively and that's more than enough.
Start with the outer boundaries: C10 on the call side and P10 on the put side. These represent where the most aggressive speculators are targeting, and they frequently correspond to the session's highs and lows. From there, look at the distance between C10 and C50 (or P10 and P50). If that gap is narrow, conviction is concentrated. If it's wide, speculation is scattered. You don't need to track every individual line in real time. The outer boundary tells you range, the gap between the outer and median tells you conviction, and the direction they're all trending tells you momentum. Those three reads cover the vast majority of what SpecPA has to offer.
This actually happens, and it's useful information. The most common version: VolM shows a clear trending pattern (both concentrations heading higher), but SpecPS shows the slope fading toward zero. That's not a contradiction. It's telling you the trend is intact but losing energy. The direction hasn't changed, but the rate at which speculation is pushing in that direction is slowing down. In practice, that means the trend may continue to drift in the same direction, but it's unlikely to accelerate from here. It's a signal to manage what you have rather than add new exposure. Think of VolM as telling you "which direction" and SpecPS as telling you "how much gas is left in the tank." When they agree, you have full conviction. When SpecPS starts fading while VolM still looks constructive, the trend isn't broken, but the easy money phase is likely over.
In Part 1, you learned how to read the center of speculation and identify the five patterns that define every trading session. Now you have the full picture. SpecPA shows you how wide or narrow conviction is across every cohort of speculators, where the boundaries of speculation sit, and whether those boundaries are tightening or spreading. SpecPS tells you whether the energy behind a move is building, sustaining, or spent.
Together, these tools answer a progression of questions that builds from simple to comprehensive.
Each layer adds depth without adding complexity. You can stop at VolM and have more than enough for most sessions. Or you can drill into the spaghetti models and slope charts when the situation calls for more granularity.
Price follows speculation. That principle hasn't changed from Part 1 to Part 2. What's changed is how many dimensions of that speculation you can now see.
So here's what we'd suggest: on your next trading session, start with VolM like you normally would. Identify the pattern. Then pull up SpecPA alongside it and watch how the bands behave relative to the concentration lines. Notice when they're tight versus scattered. Notice when price respects the outer boundary versus slicing through it. Give SpecPS a glance when you're sitting at a key level and want to know if the move has legs. Let the tools layer naturally into your workflow rather than trying to watch everything at once.
Every trading day, the volume is telling a story. Now you have the tools to hear all of it.
This way of thinking about intraday options volume may be entirely new for you. That's precisely why we created the GammaEdge FastPass, our flagship educational course designed to accelerate your learning curve significantly. As with all of our education, it's completely free to you and gives you everything a paid member of our community gets. That includes our methodologies, strategies, frameworks, and more. We hold nothing back.